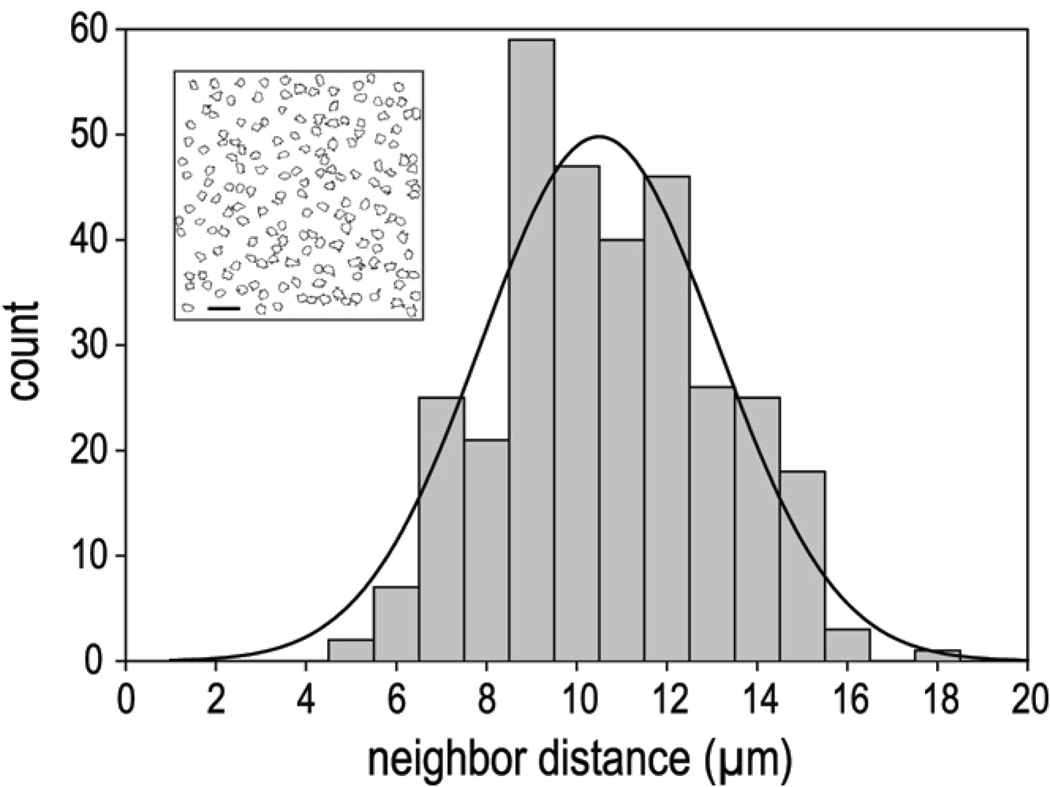
Figure 7.
Nearest neighbor analysis. Histogram of nearest neighbor distances for the DARPP-32 positive cells in Figure 6, panel C. The overlaying curve is a best-fit single Gaussian. The corresponding mean inter-soma distance of the Gaussian fit is 10.5 µm (± 0.2 µm, Standard Error). The inset is the result of the Threshold and Particle analysis performed in ImageJ, showing cell outlines selected for nearest neighbor determination. Scale bar is 25 µm.

