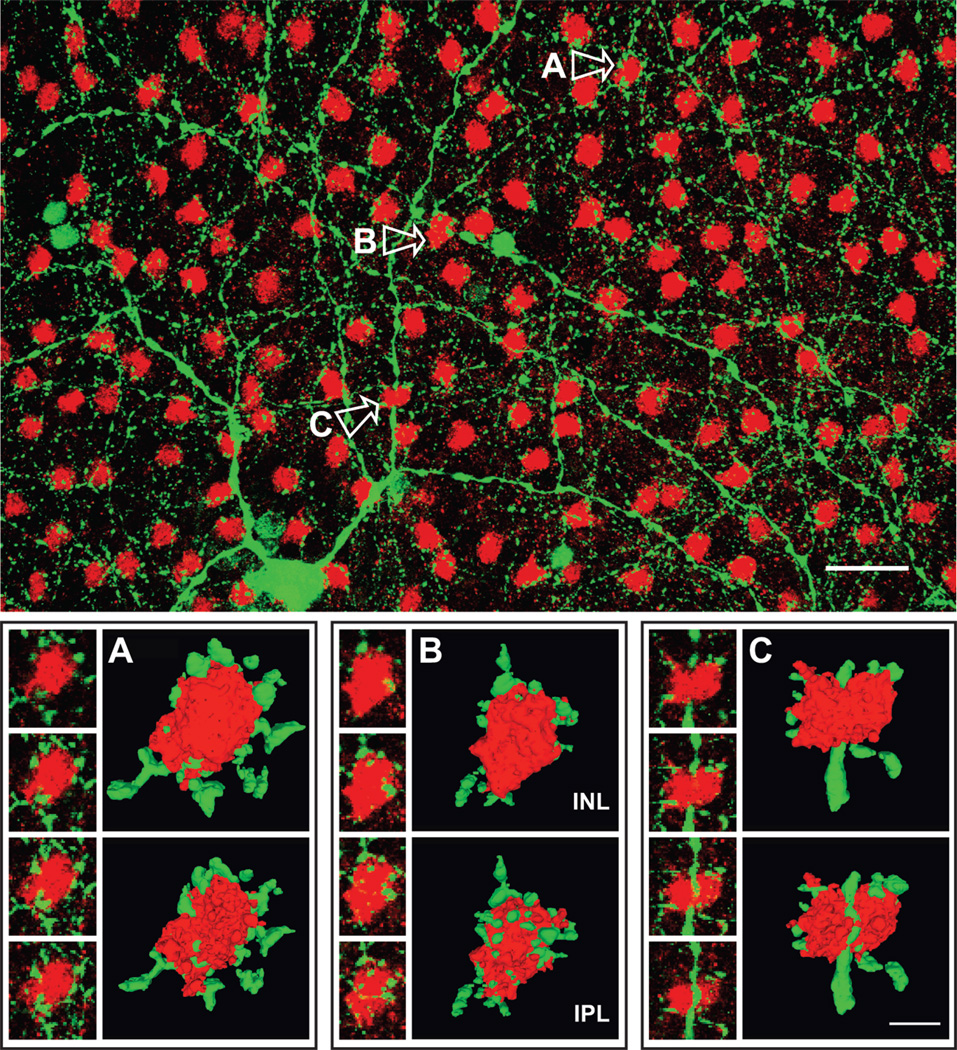
Figure 8.
Colocalization of tyrosine hydroxylase (TH) and DARPP-32 in whole retina. The upper panel is an overlay image of TH-positive cells (green) visualized with anti-TH antibody and Alexa Fluor 488-conjugated anti-mouse IgG and DARPP-32-positive cells (red) stained with anti-DARPP-32 and Alexa Fluor 594. Confocal images were obtained at 0.30 µm z intervals with 2-frame Kalman averaging. This image is a maximum intensity z-projection of 5 consecutive optical sections. The scale bar is 25 µm. The small images in each of the lower panels are high magnification single optical sections of the DARPP cells and associated TH processes labeled A–C in the upper panel. These are alternate sections, spaced 0.6 µm apart, and the direction of movement going from the top image down is toward the vitreous. Next to these are corresponding 3D reconstructions rendered in the image analysis program Volocity. For each cell, we show the face-on view as the cell would look from inside the inner nuclear area (INL) and the view of the opposite side facing the inner plexiform layer (IPL). Each pair of images was constructed by progressing in the same direction through the stack of optical sections; the second view in each pair was then rotated 180° about the y-axis, so that structures in the paired images can be more easily compared. These reconstructions utilized 25 consecutive optical sections of DARPP-32, TH image pairs from which the overlay images shown to the left were drawn. The scale bar in C is 5 µm, and the 3D images in all panels are shown at the same magnification.

