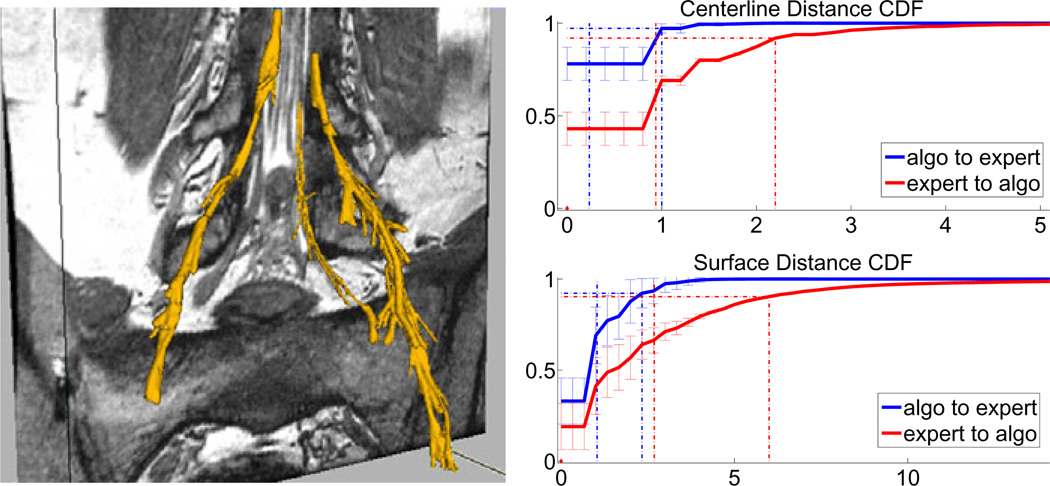
Fig. 3.
Left: Example segmentation results – the rightmost nerve shows results without post-processing pruning, while the left segmentation was processed after completion of tracking. as described at the end of Section 2. Right: Cumulative distribution functions of distances (in voxels) between the automatically extracted and manual segmentations: centerline distances on top and surfaces on the bottom. Blue plots indicate differences from algorithm to expert segmentation voxels, red plots correspond to expert-to-algorithm distances. Error bars indicate standard deviations. Dotted vertical lines indicate mean (lower) and 90th percentiles distances (higher).

