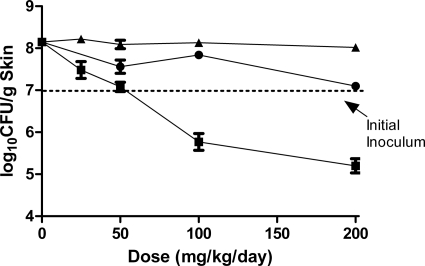
Fig. 3.
The effect of JNJ-Q2 (p.o., squares), ciprofloxacin (i.p., triangles), and moxifloxacin (p.o., circles) on established MRSA ATCC 43300 skin infections. Each symbol represents the mean ± standard error for 14 to 16 mice. The starting inoculum was 7.0 log10 CFU/mouse, and untreated control values (3 days) were 8.2 log10 CFU/g skin tissue. The P values were generated by comparing the slopes of the dose-response curves for JNJ-Q2 versus ciprofloxacin (P value, <0.0007) and for JNJ-Q2 versus moxifloxacin (P value, <0.0379) (note that the modeling contains a term for dose * treatment interaction determinations).

