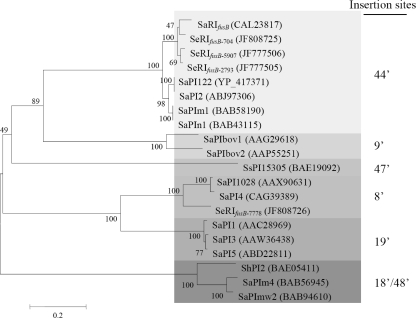
Fig. 3.
Phylogenetic relationships among integrases based on amino acid sequences collected from PIs. The phylogenetic tree was generated by using the neighbor-joining method in the MEGA4 package. Numbers at nodes are confidence levels expressed as percentages of occurrence in 500 bootstrapped resamplings. The scale bar indicates the evolutionary distance between sequences determined by measuring the lengths of the horizontal lines connecting two organisms. GenBank accession numbers for integrases are shown in the parentheses. Different degrees of gray indicate PI insertions into different sites based on the S. aureus chromosome (Fig. 2).

