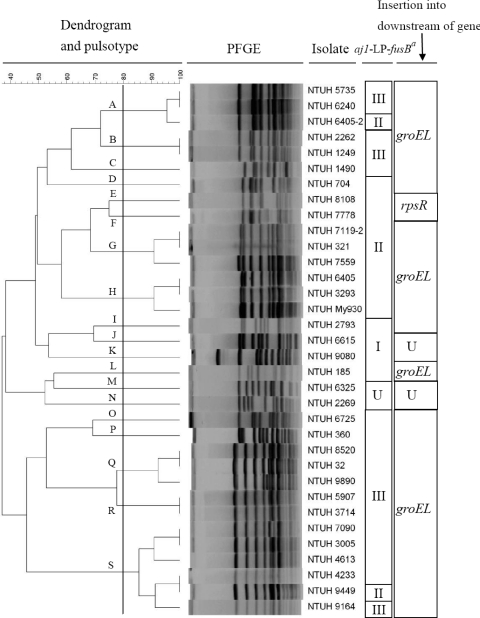
Fig. 4.
Dendrogram produced by BioNumerics software, showing distances calculated by Dice similarity index of SmaI-digested DNA fragments among 34 fusB-carrying S. epidermidis isolates. The degree of similarity is shown in the scale. Different degrees of gray indicate aj1-LP-fusB types. a, aj1-LP-fusB types; b, insertion sites of resistance islands; U, undetermined.

