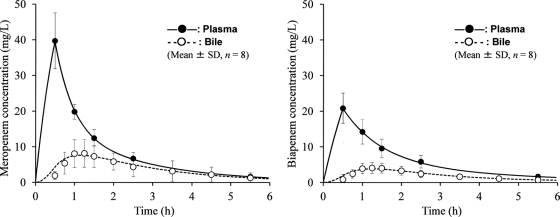
Fig. 3.
Observed concentrations (mean ± SD; n = 8) and simulation curves for plasma and bile after 0.5-h infusions of meropenem (0.5 g) and biapenem (0.3 g). The simulation curves were generated using the mean fixed-effects parameters for each drug (Table 3).

