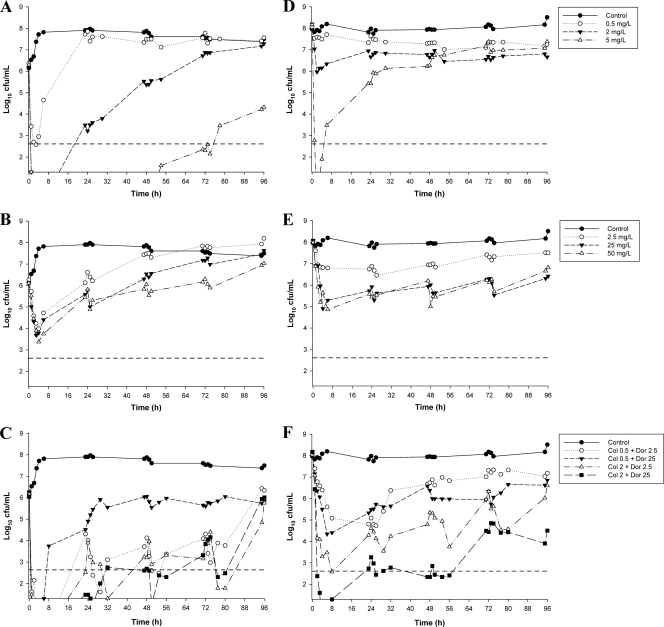
Fig. 2.
Time-kill curves for colistin monotherapy (A and D), doripenem monotherapy (B and E), and combination therapy (C and F) against ATCC 27853 at the 106-CFU/ml inoculum (left panels) and the 108-CFU/ml inoculum (right panels). The y axis starts from the limit of detection, and the limit of quantification (LOQ) is indicated by the horizontal broken line.

