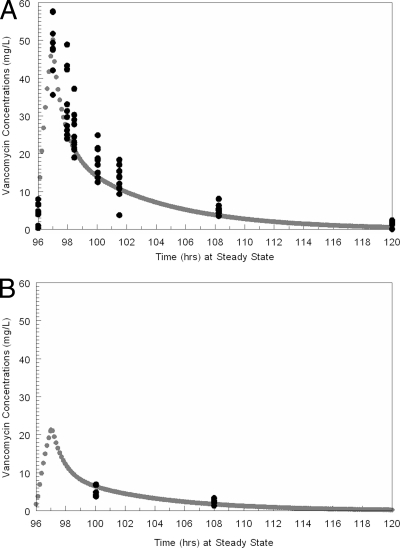
Fig. 2.
Simulated concentration-time profile of 1,000 mg vancomycin IV q12h from the mean parameter vector values in plasma (A) and ELF (B). Black circles are the measured vancomycin concentrations, and the gray line and circles are the pharmacokinetic simulated fit of the concentration-time profile.

