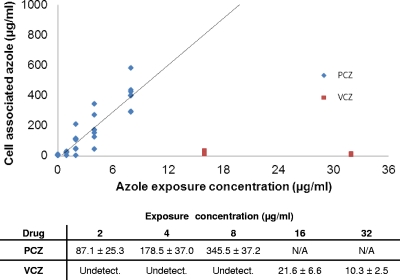
Fig. 2.
Relationship of exposure concentration to cell-associated concentrations of azoles. A549 cells were exposed to posaconazole and voriconazole at the indicated concentrations for 4 h. Free drug was removed by washing; then the cells were collected and the respective azole drug concentrations determined using HPLC. Individual assay results for each exposure concentration are shown graphically, and the mean drug concentration ± standard error of the mean is shown in the table below. All results are the aggregate of results from at least three independent experiments.

