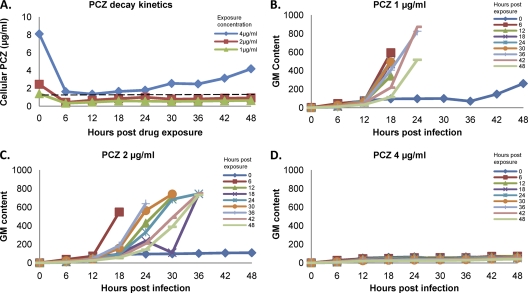
Fig. 4.
Posaconazole kinetics within epithelial cells and the effects on fungal growth inhibition. (A) A549 cells were exposed to posaconazole for 4 h and then harvested every 6 h after drug removal. The cellular posaconazole concentration at each time point was then determined using HPLC. The dotted line indicates the threshold concentration above which A. fumigatus growth was inhibited (see panels B to D). (B to D) In parallel, A549 cells exposed to the indicated concentration of posaconazole, as in panel A, were infected with A. fumigatus conidia at each of the 6-h intervals. Fungal growth was quantified by serial sampling of the culture supernatant for galactomannan determination. The inset indicates the time between free drug removal and infection of cells with conidia.

