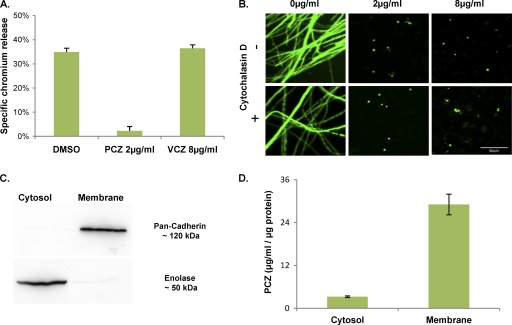
Fig. 6.
Effects of posaconazole on A. fumigatus induced cell injury and localization of posaconazole within host cells. (A) A549 cells were loaded with 51Cr and then exposed to the indicated antifungal agents for 4 h before being infected with A. fumigatus conidia. The extent of epithelial cell damage was determined by measuring the amount of 51Cr released by the infected cells. Data are the mean ± standard deviation of results of three experiments, each performed in triplicate. (B) A549 cells were exposed to various concentrations of posaconazole, with or without cytochalasin D. These cells were then infected with eGFP-expressing A. fumigatus conidia and visualized after 30 h growth using confocal microscopy. (C) A549 cells exposed to 8 μg/ml posaconazole for 4 h were separated into membrane and cytosolic fractions by differential centrifugation. Aliquots of each fraction were assayed using Western blotting to confirm the purity of each sample. An anti-pan-cadherin antibody was used for the cell membrane fraction, and an anti-enolase antibody was used for the cytosolic fraction. (D) Subcellular fractions from panel C were then assayed for posaconazole concentrations using HPLC. Posaconazole content was then normalized to total protein concentrations. Results are the mean concentrations obtained from three separate experiments on three independent occasions.

