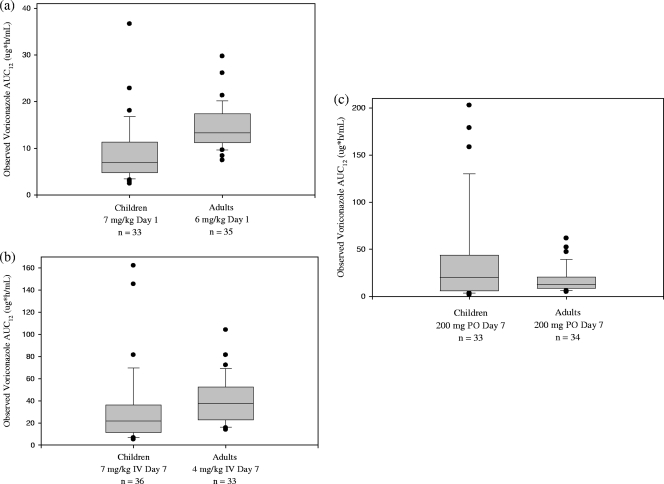
Fig. 1.
Comparison of observed voriconazole AUC0–12 in children to those in adults on day 1 of IV treatment (a), day 7 of IV treatment (steady state) (b), and day 7 of oral treatment (steady state) (c). The box plot provides the median value with 10th, 25th, 75th, and 90th percentiles; values outside the 10th to 90th percentiles are presented as solid circles.

