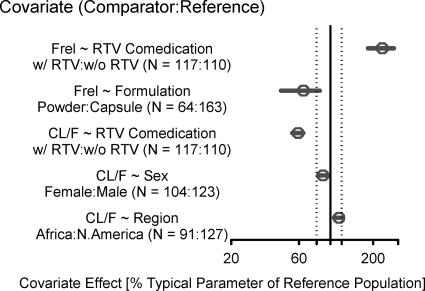
Fig. 1.
Effects of categorical covariates on ATV PK parameters (CL/F and Frel). An open circle shows the estimated covariate effect compared to the reference. Error bars show the 95% confidence interval (95% CI) for the covariate effect. The covariate effect for the reference is considered 100% (vertical solid line), and dashed vertical lines show 80% and 120% of the reference effect.

