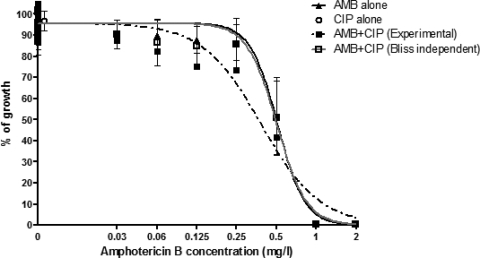
Fig. 3.
Double combination of amphotericin B (AMB) and ciprofloxacin (CIP). Concentration-effect data and regression curves for AMB alone, CIP alone, the double combination AMB+CIP at a fixed ratio of 1:3.125, and the AMB+CIP Bliss independence theoretical combination if AMB and CIP act independently. Error bars represent standard errors among 6 replicates. Bliss synergy was found at low concentrations of AMB, as the experimental curve (dashed black line) is to the left of the theoretical concentration-effect curve (gray line) of AMB+CIP (i.e., a lower percentage of growth was obtained when AMB was combined with CIP than was obtained by the theoretical combinations). At higher AMB concentrations, the experimental curve is to the right of the theoretical concentration-effect curve of the AMB+CIP combination, resulting in Bliss antagonism. The open circle next to the y axis corresponds to 0 μg/ml of AMB, but it was shifted to the right for visualization purposes.

