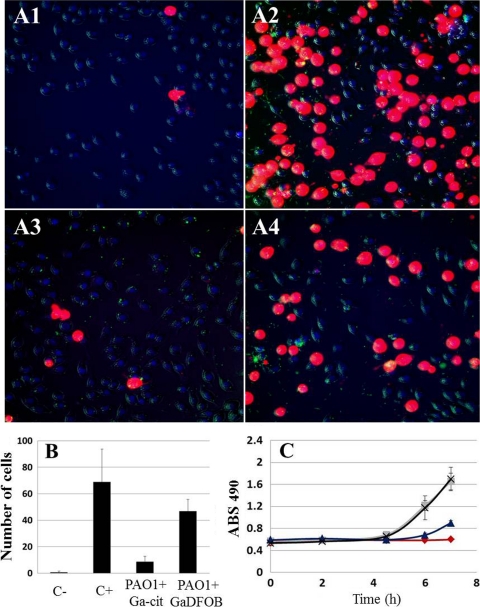
Fig. 7.
Degree of cytotoxicity resulting from a P. aeruginosa PAO1 infection of J774 macrophages, as measured by LDH release and propidium iodide uptake. (A) Live-cell microscopy of J774 macrophages infected with P. aeruginosa PAO1 (green dots in panels A1 to A4) at an MOI of 0.5; at 4.5 h postinfection, more damaged cells were seen in the presence of Ga-DFOB than in Ga-Cit. (A1) No bacteria and no Ga; (A2) no Ga; (A3) bacteria and 150 μM Ga citrate; (A4) bacteria and 150 μM Ga-DFOB. (B) Propidium iodide toxicity test showing a higher number of damaged cells during macrophage infection by P. aeruginosa PAO1 with Ga-DFOB than with Ga-citrate 4.5 h postinfection (based on quantification of live-cell microscopy data). Macrophages were counted in seven fields for every condition; significant differences were found for all samples compared to the negative control (P ≤ 0.05). (C) LDH toxicity test showing a time-dependent increase in damaged cells during macrophage infection by P. aeruginosa PAO1 in samples with Ga-DFOB or Ga-Cit; in samples with Ga-DFOB, values are similar to positive controls, while in the presence of Ga citrate, the absorbance is half of that for Ga-DFOB. Squares, no Ga; crosses, bacteria and Ga-DFOB; diamonds, no bacteria and no Ga; triangles, bacteria and Ga-Cit.

