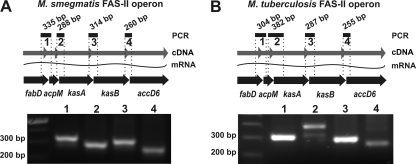
Fig. 6.
PCR analysis of the FAS-II gene cluster structure. Four PCRs were prepared using four sets of primers covering intergenic sequences and total-cDNA matrices from M. smegmatis (A) and M. tuberculosis (B). The lane numbers (bottom) correspond to the numbered PCR products shown in the schematic (top). The expected product sizes are given. In the schematics, the genes of the FAS-II cluster are marked as thick black arrows, while the wavy lines represent isolated mRNA, and the gray arrows represent the total cDNA obtained by reverse transcription. See Table S2 in the supplemental material for a description of the primers utilized.

