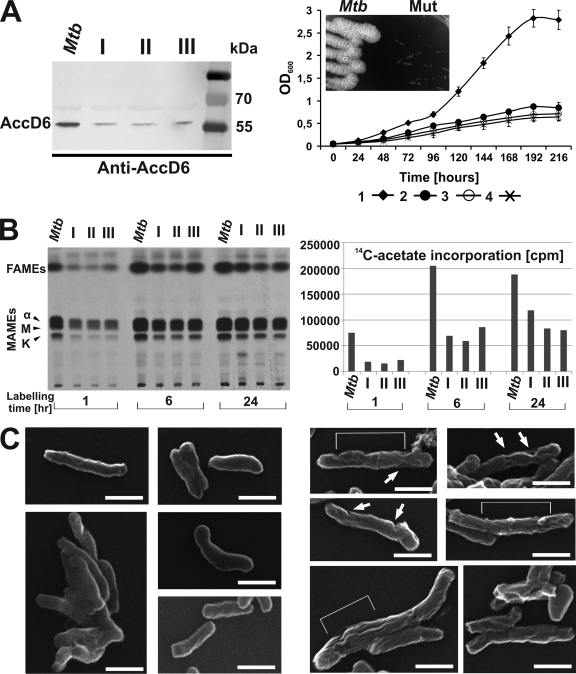
Fig. 8.
Phenotypic analysis of the ΔaccD6Mtb-Pacc-accD6Mtb mutants. (A) (Left) Western blot analysis of total crude lysates from M. tuberculosis (Mtb) and three independently obtained ΔaccD6Mtb-Pacc-accD6Mtb mutants (I, II, and III), probed with rabbit anti-AccD6 antibodies. (Right) Analysis of the growth rates of three ΔaccD6Mtb-Pacc-accD6Mtb strains (curves 2, 3, and 4) and wild-type M. tuberculosis (curve 1) grown under aeration in 7H9 medium supplemented with OADC. All values are means ± standard errors from three independent experiments. (Inset) Growth of the ΔaccD6Mtb-Pacc-accD6Mtb mutant (Mut) with respect to the growth of wild-type M. tuberculosis in 7H10-OADC medium. (B) Thin-layer chromatography (left) and scintillographic analysis (right) of 14C-labeled mycolic and fatty acid methyl esters extracted from exponentially growing wild-type M. tuberculosis and the three ΔaccD6Mtb-Pacc-accD6Mtb mutants (I, II, and III). Samples were withdrawn after 1, 6, and 24 h of labeling with [2-14C]acetate. The symbols α, M, and K correspond to α-mycolates, methoxy-mycolates, and keto-mycolates, respectively. (C) Scanning electron micrographs of wild-type M. tuberculosis (left) and the ΔaccD6Mtb-Pacc-accD6Mtb mutant (right). Several fields were examined, and representative samples are shown in both panels. Surface changes of the mutant cells are marked with white arrows and brackets. Bars, 1.0 μm.

