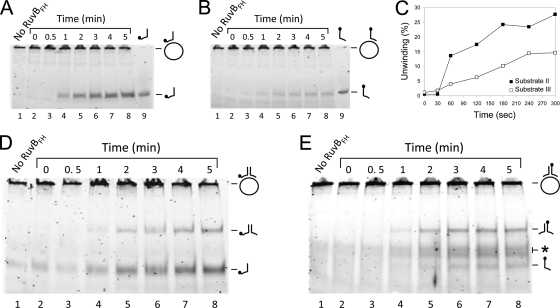
Fig. 4.
Time course of the RuvBFH-catalyzed DNA helicase reaction on different DNA substrates. The substrates that were tested were substrate II (A), substrate III (B), and substrate I, which was 6-FAM labeled at the 5′ end of either oligonucleotide 1 (D) or oligonucleotide 2 (E). Reactions were performed as described in the legend of Fig. 3 and contained either 0 μM RuvBFH or 2.7 μM RuvBFH in the presence of Mg2+ (10 mM) and ATP (2 mM). Samples were taken at the time points indicated above the lanes of the figures. The labeled oligonucleotides 1 and 2 are taken along as makers in panel A (lane 9) and panel B (lane 9), respectively. (C) Comparison of the percentage of unwinding (the percentage of displaced oligonucleotide) of substrate II (■) with that of substrate III (□). The displaced oligonucleotides were measured from the gels shown in panels A and B as the percentage of released product relative to the total substrate in the reaction mixture. The labeling of substrate and reaction products is similar to that used in Fig. 3.

