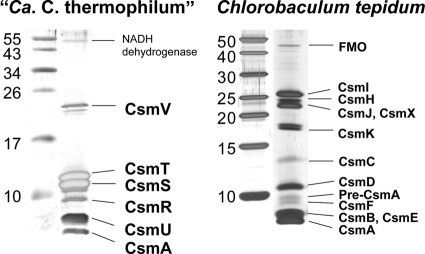
Fig. 6.
SDS-PAGE analyses showing the protein composition of isolated chlorosomes from “Ca. Chloracidobacterium thermophilum” and C. tepidum. Left lanes, molecular mass standards (sizes are in kDa). Right lanes, chlorosomes from the indicated organism. Proteins corresponding to 20 μg of BChl c were loaded on the gels and were visualized by silver staining. Each protein is identified on the right.

