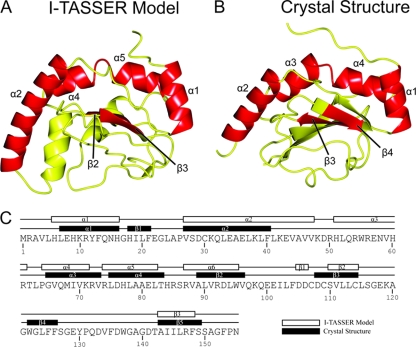
Fig. 1.
Tertiary and secondary structure comparisons of the I-TASSER model and the experimentally determined structure of CT296. (A) Ribbon depiction of the I-TASSER model of CT296. The topology of the CT296 model is as follows (with residue numbers in parentheses): α1 (H6 to H16)–α2 (V27 to V47)–α3 (H51 to R61)–α4 (P64 to K71)–α5 (R74 to L82)–α6 (R87 to W95)–β1 (D105 to D106)–β2 (S110 to C114)–β3 (A143 to F148). (B) The experimentally determined structure of CT296. The topology of the crystal structure of CT296 is as follows (with residue numbers in parentheses): α1 (L7 to H16)–β1 (H18 to F21)–α2 (V27 to F40)–α3 (G65 to V73)–α4 (L75 to T83)–β2 (A89 to V96)–β3 (D108 to C114)–β4 (W122 to F126)–β5 (A143 to S149). Secondary structure elements that are conserved between the two structures (four α-helices and two β-sheets) are labeled and highlighted in red. (C) Secondary structure topology comparison of the I-TASSER model and the experimentally determined structure of CT296.

