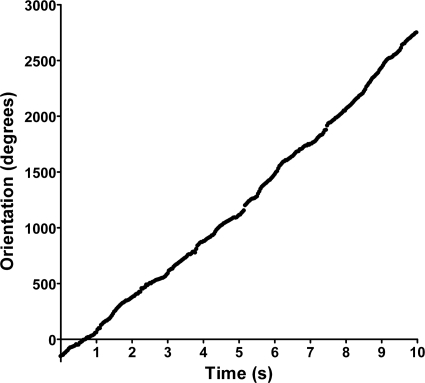
Fig. 1.
Tethered-cell analysis of Fla2 flagella from Rhodobacter sphaeroides. Cells were analyzed using CellTrak 1.5 to determine the rotational bias of flagella. The direction of orientation of individual cells is measured in degrees and given as a function of time in seconds. As cells rotate in one direction, the orientation value increases linearly. Results for an individual representative cell are shown in this graph.

