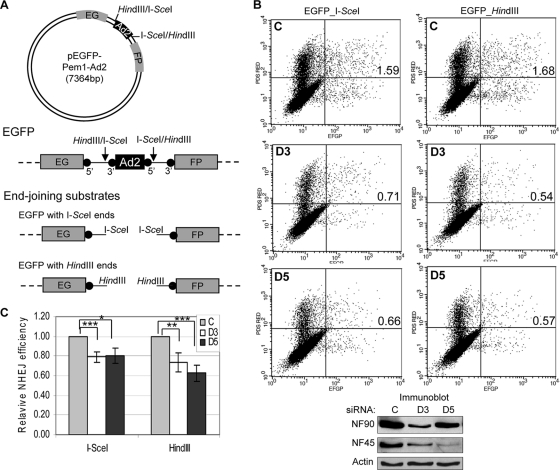
Fig. 8.
NF90/NF45 knockdown inhibits NHEJ in vivo. (A) Generation of end-joining substrate. The circular map of reporter plasmid pEGFP-Pem1-Ad2 diagrams the EGFP gene interrupted by a stuffer sequence containing an Ad2 intron. Endonuclease sites are marked. The linear diagram illustrates the positions of splice sites (solid circles) relative to the intron and endonuclease sites. Digestion with I-SceI or HindIII generates noncompatible and cohesive NHEJ substrates, respectively. (B) NHEJ in cells after NF90/NF45 knockdown. Cells were transfected with control, NF90, or NF45 siRNA (C, D3, and D5, respectively) and with the I-SceI or HindIII substrates and then analyzed by flow cytometry. Dot plots show red and green fluorescence (vertical and horizontal axes, respectively). Values inserted in individual plots enumerate EGFP-positive cells, percent of total). Immunoblots show the levels of NF90 and NF45 in siRNA-treated cells. (C) Quantitation of EGFP-positive cells normalized to DsRed-positive cells. P values: *, <0.05; **, <0.01; ***, <0.001 (based on five independent experiments with the I-SceI substrate and four independent experiments with the HindIII substrate).

