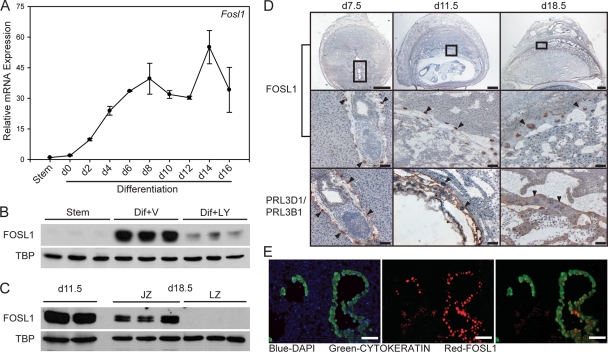
Fig. 4.
Expression of FOSL1 in Rcho-1 TS cells and rat placentation sites. (A) qRT-PCR analysis of Fosl1 expression during Rcho-1 TS cell differentiation. Experiments were performed in triplicate. (B) Western blot analysis of FOSL1 protein in nuclear lysates of stem (Stem) or differentiating Rcho-1 TS cells treated with vehicle (Dif+V; 0.01% DMSO) or LY294002 (Dif+LY; 10 μM). TBP was included as a loading control. (C) Western blot analysis of protein levels for FOSL1 in nuclear lysates from gestation days 11.5 and 18.5 placental tissues. Placental tissues isolated from gestation day 18.5 were dissected into junctional zone (JZ) and labyrinth zone (LZ) compartments. TBP was included as a loading control. (D) Immunohistochemical localization of FOSL1 in gestation days 7.5, 11.5, and 18.5 rat placentation sites. FOSL1 is localized to the nucleus of trophoblast giant cells (arrowheads). PRL3D1 (PL-I, day 7.5) and PRL3B1 (PL-II, days 11.5 and 18.5) are expressed in trophoblast giant cells (arrowheads) and were used as positive controls. Top bars = 1 mm; middle and bottom bars = 100 μm. (E) Immunofluorescence colocalization of FOSL1 and cytokeratin in gestation day 11.5 placentation sites. Nuclei were visualized with DAPI (blue). (Left) Cytokeratin and DAPI; (middle) FOSL1 and DAPI; (right) cytokeratin and FOSL1. Please note that FOSL1 colocalizes with cytokeratin in invasive endovascular trophoblast cells. Bar = 100 μm.

