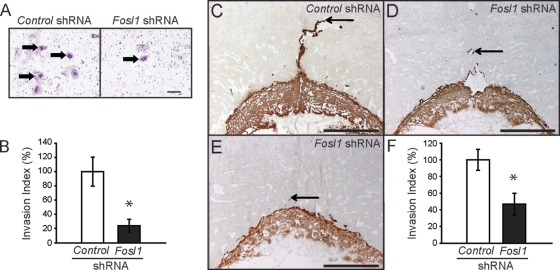
Fig. 8.
FOSL1 regulates trophoblast invasion as assessed in vitro and in vivo. (A and B) The invasive abilities of Rcho-1 TS cells expressing control or Fosl1 shRNAs were measured using Matrigel chamber assays. (A) Representative filters showing trophoblast invasion through Matrigel in control and FOSL1 knockdown cultures (cells are marked with arrows). Bar = 100 μm. (B) Graphic presentation of results from the Matrigel invasion chamber assays. Cells were counted from nine replicates and normalized to control samples. (C to F) Evaluation of the impact of FOSL1 knockdown on trophoblast invasion in vivo. Control or Fosl1 shRNAs were delivered to the trophectoderm of gestation day 4.5 blastocysts by use of a lentiviral delivery system and transferred to pseudopregnant rats, and placentation sites were evaluated on gestation day 11.5. (C to E) Immunohistochemistry of rat placentation sites was performed using anti-cytokeratin to identify trophoblast. Representative sections of gestation day 11.5 placentation sites for control shRNA (C) and Fosl1 shRNA (D and E) samples are shown. Bars = 1 mm. (F) Quantification of the invasion index (see Materials and Methods). Sample sizes: control, n = 12; Fosl1 shRNA, n = 9. Bars represent means ± SEM. Values significantly different from controls are indicated (*, P < 0.05).

