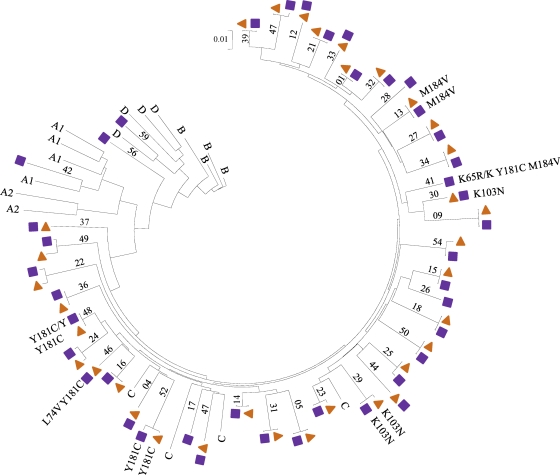
Fig. 2.
Phylogenetic relationships of sequences obtained from matched dried-blood-spot and plasma samples (P1060 trial). A phylogenetic tree constructed using sequences obtained using DBS samples (n = 41; 41 symbols) or plasma samples (n = 34; 34 symbols) is shown; 34 of the samples are matched (prepared from the same whole-blood collection). Reference sequences for subtype C are indicated with “C.” Mutations detected in the samples are shown.

