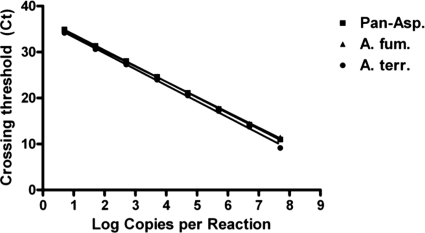
Fig. 2.
Real-time PCR linearity and dynamic range. Five to 5 × 10⁷ copies of each assay's target region were introduced into real-time PCR wells and analyzed to determine crossing thresholds. The log copy number detected per reaction was plotted versus the crossing threshold for pan-Aspergillus (squares), A. fumigatus (triangles), and A. terreus (circles).

