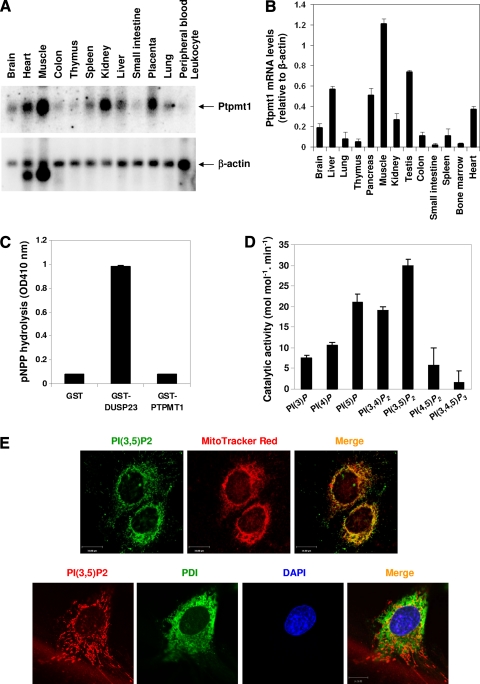
Fig. 1.
Characterization of Ptpmt1 phosphatase. (A) The human tissue RNA blot (Clontech, Mountain View, CA) was hybridized with [α-32P]dCTP-labeled human Ptpmt1 cDNA probe by following a standard protocol. The blot was stripped and reprobed with the β-actin probe to check RNA loading. (B) Total RNA was extracted from the indicated mouse tissues. Ptpmt1 mRNA levels in these RNA samples were determined by real-time PCR following standard procedures. (C and D) Glutathione S-transferase (GST)–Ptpmt1 fusion protein was carefully purified and tested for its phosphatase activity using pNPP (OD410 nm, optical density at 410 nm) (C) or the indicated PIPs (Echelon Biosciences, Inc., Salt Lake City, UT) (D) as substrates as we previously reported (38). GST-DUSP23 was included as the positive control (C). (E) MEFs were loaded with MitoTracker Red (Molecular Probe, Eugene, OR) and then immunostained with anti-PI(3,5)P2 antibody (Echelon Biosciences Inc., Salt Lake City, UT) (upper panel) or the cells were double immunostained with anti-PI(3,5)P2 and anti-protein disulfide isomerase (PDI; a specific marker for the endoplasmic reticulum) (Stressgen, Ann Arbor, MI) antibodies (lower panel). Images were analyzed with the Zeiss laser scanning microscope LSM510 confocal imaging system. Scale bar = 15 μm.

