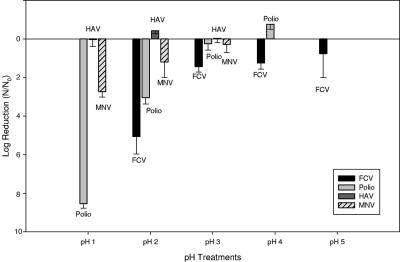
Fig. 2.
Virus pH tolerance. The bar graph depicts the log reduction of each virus, with standard deviation bars, after immersion in acidic buffers ranging from pH 1 to 5 for 30 min. Only FCV was evaluated in pH 5 buffer, and MNV and HAV stocks were not evaluated at pH 4. After immersion in pH 2 buffer, no FCV plaques were detected. After immersion in pH 1 buffer, no PV plaques were observed. Initial titers were 4.8 × 10⁷ PFU/ml for HAV, 1.1 × 10⁹ PFU/ml for PV, 7.5 × 10⁵ PFU/ml for MNV, and 5.8 × 10⁷ PFU/ml for FCV (N = 3; n = 9).

