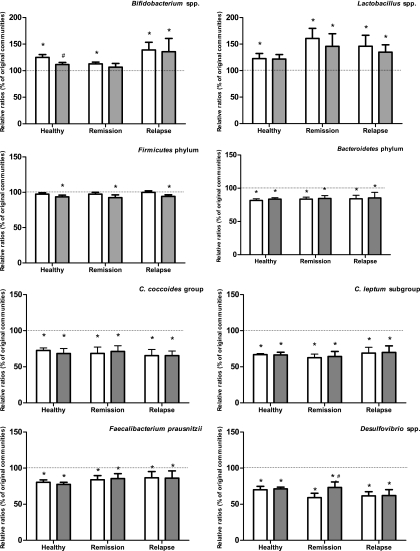
Fig. 2.
Relative ratios (RR) of target genes in samples incubated with FOS (white) and AOS (gray) compared to original bacterial communities, calculated as RR = EΔCT (fermentation samples)/EΔCT (original bacterial community). Original communities were set to 100% for each group (indicated by dotted lines). Error bars represent averages ± standard errors of the means of relative changes in target species in each of the six samples in each group. Asterisks (*) indicate significant differences from the original bacterial communities, while pound signs (#) indicate significant differences from FOS-fermented samples.

