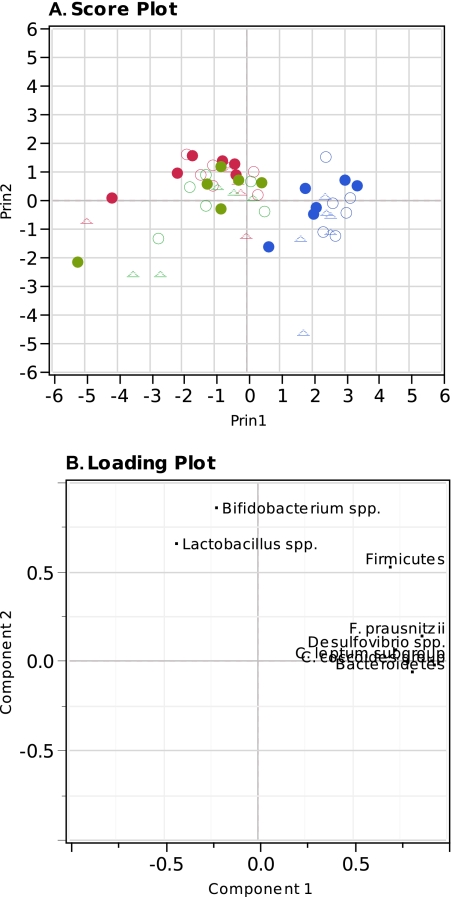
Fig. 3.
Principal component analysis of the quantitative PCR measurements using the first and second principal component (PC1, 54.94%; PC2, 18.66%). (A) Score plot showing the original bacterial communities (blue), samples incubated with FOS (red) and samples incubated with AOS (green). Sources of the communities are indicated by open circles (○) for healthy subjects, closed circles (•) for UC patients in remission, and triangles (Δ) for UC patients in relapse. (B) Loading plot, indicating each of the measured bacterial taxa as determined by quantitative real-time PCR.

