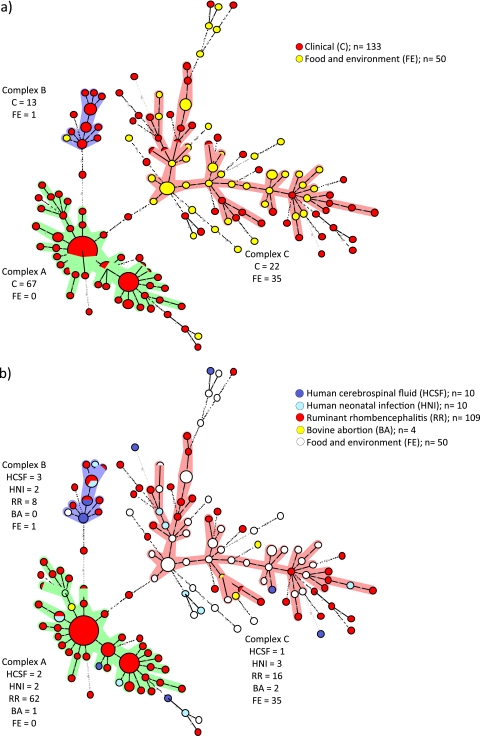
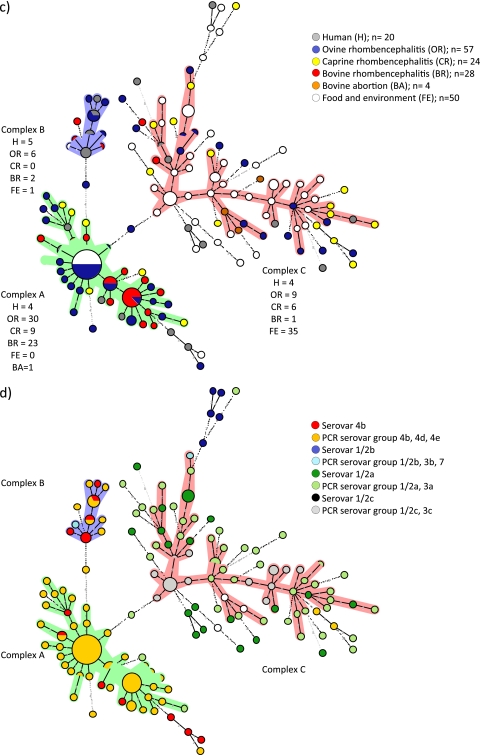
Fig. 1.
Minimum-spanning-tree analysis of 183 L. monocytogenes isolates based on eight genetic markers. Circles represent all isolates, and their size is proportional to the number of isolates. Colored zones surrounding the circles delineate the different clonal complexes. Clonal complexes were created based on the maximum neighbor distance of changes at two loci and the minimum size of five types. The length of the branches represents genetic distances (changes in loci are represented with numbers) between two neighboring types. The color codes indicate the clinical or nonclinical origin of the isolates (a), the specific origin of clinical isolates (b), the human and ruminant species (c), and the serovar or the PCR-based serovar group (d).


