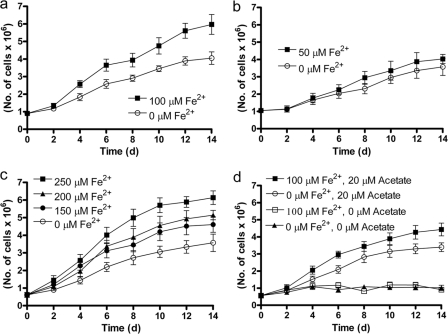
Fig. 4.
Comparisons of growth curves of Acidovorax sp. 2AN in organotrophic and mixotrophic media with various Fe2+ concentrations. Each panel represents a different set of experiments. The same inoculum was used in each set of experiments as described in the text. All media contained 100 μM NO3− and, except where noted in panel d, 20 μM acetate. The data are presented as mean ± the standard deviations for cell counts in 10 microscopic fields.

