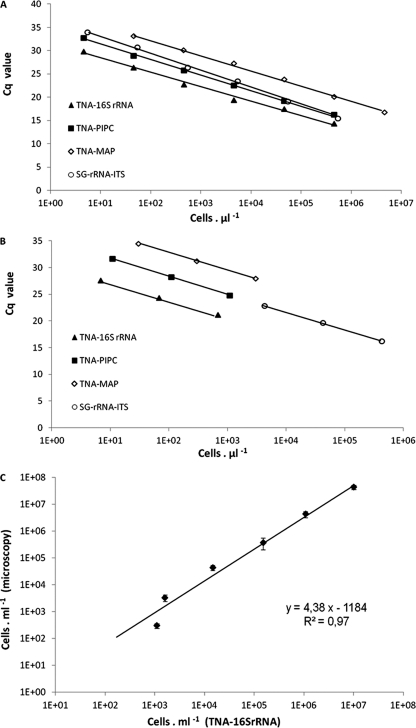
Fig. 1.
Examples of qPCR standard curves obtained for Taq nuclease assays (TNA-16S rRNA, TNA-PlPC, and TNA-MAP) and the SYBR green assay (SG-rRNA-ITS), generated after amplification of predetermined concentrations (log scale) of MC-producing P. rubescens strain TCC 29 (A) and Lake Bourget sediment sample B5-1 (B). For the description of all curves, see Table 2. (C) Correlation between P. rubescens strain TCC 29 cell densities estimated by microscopic counting and those estimated by TNA-16S rRNA. Error bars, which are hidden by the symbols in almost all cases, give the standard deviations for three independent amplifications.

