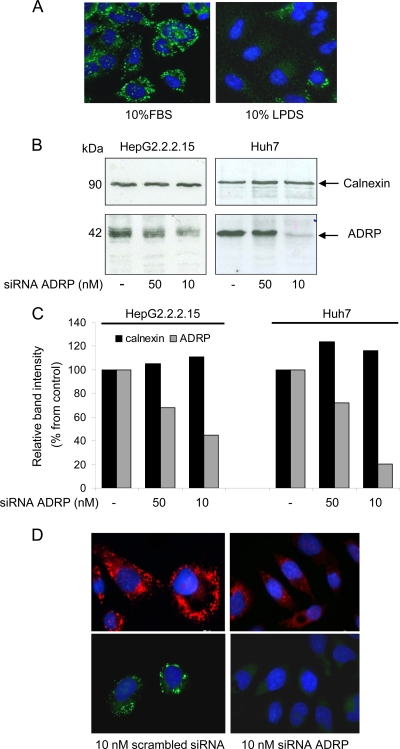
Fig. 6.
Inhibition of LDs biosynthesis in HBV-producing cells. (A) HepG2 2.2.15 cells were grown for 24 h in complete medium containing either FBS or LPDS. LDs were stained with Bodipy 493/503 and visualized using a Nikon E600 fluorescence microscope. (B) HepG2 2.2.15 and Huh7 cells were transfected with different concentrations of ADRP-specific siRNA or scrambled siRNA (lanes −). Cells were lysed at 48 h pt, and equal amounts of protein were loaded on SDS-polyacrylamide gels. ADRP and calnexin (protein loading control) expression was analyzed by Western blotting using specific Abs. (C) ADRP and calnexin levels were quantified using Quantity One software. (D) HepG2 2.2.15 cells were transfected with 10 nM either ADRP-specific or scrambled siRNA for 24 h. ADRP expression (top) and LD core (bottom) were evidenced by fluorescence microscopy, using ADRP-specific Abs or Bodipy 493/503 and a Nikon E600 fluorescence microscope.

