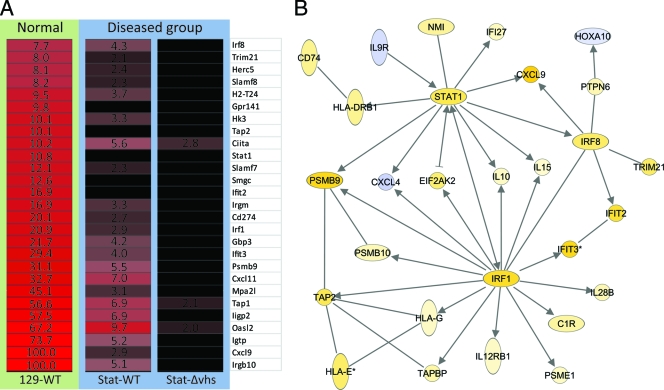
Fig. 2.
Protective signature genes. Control or Stat1−/− mice were inoculated on the cornea with 2 × 10⁶ PFU/eye of HSV-1 WT or HSV-1 Δvhs or treated with a mock lysate. At the indicated time postinfection, RNA was harvested and processed for array analysis. (A) Heat map showing ANOVA results for differentially expressed genes within the cutoff values of ≥2-fold change and ANOVA P ≤ 0.01 in brain stems comparing nondiseased (WT virus-infected strain 129 control mice) and diseased (WT virus-infected Stat1−/− mice and Δvhs virus-infected Stat1−/− mice) models at 5 dpi. Red and black colors indicate upregulated and unchanged genes, respectively, compared to a mock-treated sample. The numbers indicate fold changes compared to results for a mock-treated sample. (B) Functional network analysis of 5 dpi ANOVA results determined by Ingenuity Pathways Analysis. Arrows indicate functional interactions between genes. Yellow and blue colors indicate up- and downregulated genes, respectively.

