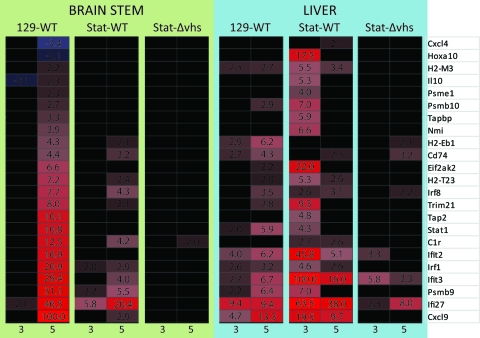
Fig. 3.
Comparison of protective responses in brain stem and liver. Heat map comparing gene expression changes in the brain stems and livers of WT virus-infected control mice and WT or Δvhs virus-infected Stat1−/− mice at 3 and 5 dpi. Differentially expressed genes identified in the protective gene signature analysis are shown. Red and black colors indicate upregulated or unchanged genes, respectively, compared to a mock-treated sample. The numbers indicate fold changes compared to results for a mock-treated sample.

