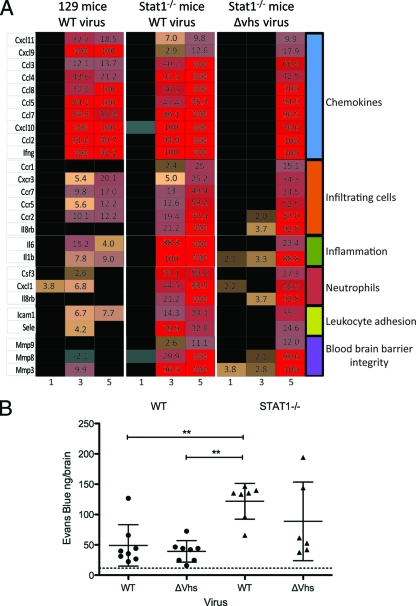
Fig. 4.
Pathogenicity genes and BBB permeability. (A) Heat map showing selected, differentially expressed genes within the cutoff values of ≥2-fold change and ANOVA P ≤ 0.01 in brain stems from WT virus-infected control mice, WT virus-infected Stat1−/− mice, or Δvhs virus-infected Stat1−/− mice at 5 dpi. The numbers indicate fold changes compared to results for mock-infected mice. (B) Quantification of Evans blue dye in brain tissue of infected mice. WT or Δvhs virus-infected control and Δvhs virus-infected Stat1−/− mice are shown at 7 dpi. WT virus-infected Stat1−/− mice were moribund at 7 dpi, and so data are shown for 6 dpi. The amount of dye is reported in ng/brain. The dotted line indicates the background level of Evans blue dye. *, P < 0.01.

