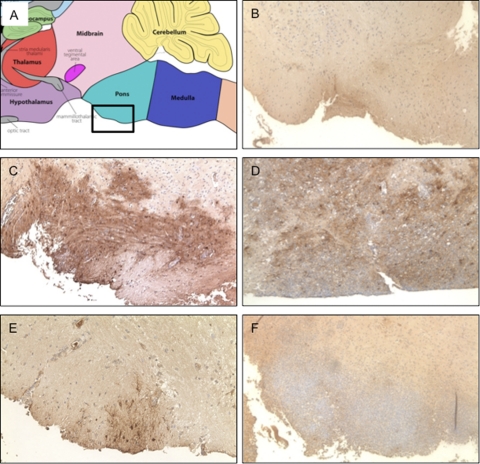
Fig. 6.
Histological analysis of brain stem tissue. (A) Map taken from the Gene Expression Nervous System Atlas (GENSAT) Project (www.gensat.org) shows the region of the brain examined in the subsequent panels. (B) Control mice infected with WT virus, 5 dpi. (C) Stat1−/− brain infected with WT virus, 5 dpi. (D) Stat1−/− mice infected with WT virus, 7 dpi. (E) Stat1−/− mice infected with Δvhs virus, 5 dpi. (F) Stat1−/− mice infected with WT virus, 7 dpi. Mice were inoculated with 2 × 10⁶ PFU/eye of virus per eye, and brain stems were harvested and fixed for histological analysis at times indicated. Tissue sections were stained for HSV-1 antigen (brown) and counterstained with hematoxylin. Representative images are shown of the pons area in the brain stem where the trigeminal ganglia connect to the brain stem.

