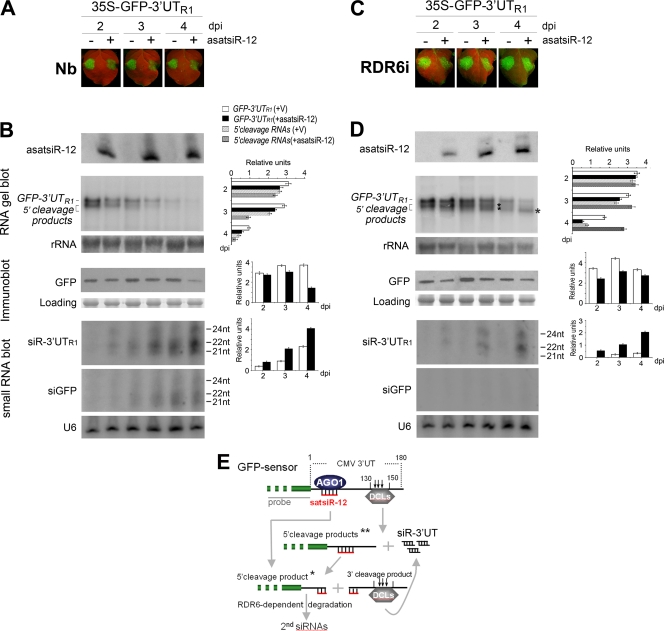
Fig. 3.
Analysis of the effect of asatsiR-12 on regulating expression of GFP-3′UTR1. (A and C) Observation of GFP fluorescence in samples from wild-type N. benthamiana plants (Nb) (A) and RDR6i plants (C) coexpressing GFP-3′UTR1 with asatsiR-12 or a vector control (−). Photographs were taken under UV light at 2, 3, and 4 dpi. (B and D) Detection of the expression of asatsiR-12 and the accumulation of GFP-3′UTR1 RNA, 5′ cleavage products, 3′UTR1-derived siRNAs (siR-3′UTR1), and GFP-derived siRNAs (siGFP), as well as the accumulation of GFP, in wild-type N. benthamiana plants (B) and RDR6i plants (D). 32P-labeled GFP DNA probes and GFP-specific antibodies were used. For small RNA blots, 32P-labeled in vitro transcripts from RNA1 construct 3′UTR1 and from GFP were used as probes. Methylene blue-stained rRNA, U6 RNA hybridization, and Coomassie blue-stained total proteins are shown as RNA and protein loading controls. Pools of samples collected from four plants were analyzed for each time point. Quantification of GFP-3′UTR1, 5′ cleavage products, GFP, and siGFP relative to the loading control are shown to the right of each panel using ImageQuant TL (GE Healthcare Life Sciences). +V, in the presence of the control vector. (E) A sketch map for the possible cleavage of GFP sensor RNA mediated by asatsiR-12 and DCLs (18). * indicates an asatsiR-12-mediated 5′ cleavage product, and ** indicates DCL-mediated cleavage products (18).

