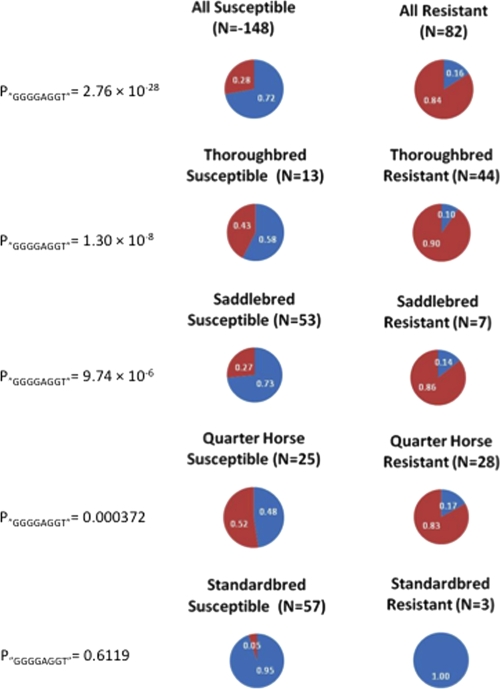
Fig. 5.
Frequency of the GGGGAGGT haplotype found for selected SNPs between ECA11 positions 49572804 to 49643932 among horses susceptible and resistant for the EAV in vitro infection phenotype. The blue area in the pie chart represents the proportion of the GGGGAGGT haplotype, and the red area represents the allelic haplotypes. The frequency represented by each section of the pie chart is shown on the pie chart in white. Data are represented for all horses together (All) and for the individual breeds (Thoroughbred, American Saddlebred, Quarter Horse, and Standardbred). The statistical significance for the frequency differences of the GGGGAGGT haplotype between susceptible and resistant horses is shown to the left of each set of pie charts (P“GGGGAGGT”).

