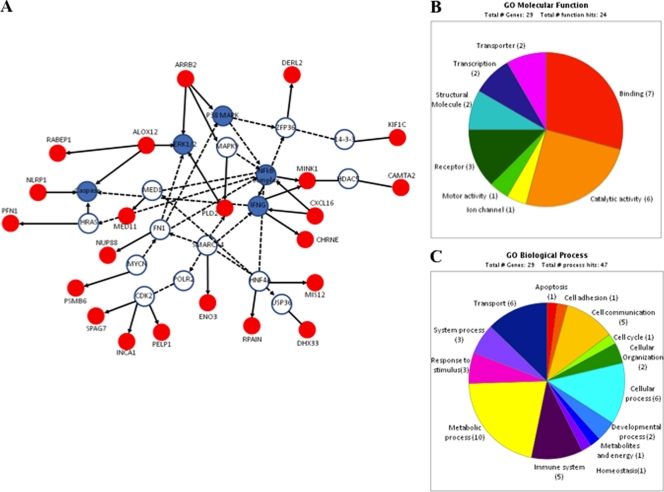
Fig. 6.
(A) Three top networks retrieved using unsupervised IPA were merged into a single interaction network. Red nodes represent molecules encoded by genes found in the region of ECA11; white nodes are genes identified by IPA with direct or indirect interactions with genes of ECA11. The blue nodes represent molecules/complexes identified by IPA involved in canonical pathways. Classification of candidate molecules based on their molecular functions (B) and biological processes (C).

