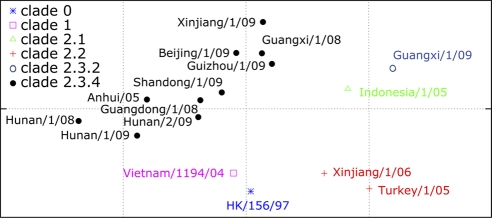
Fig. 3.
The antigenic cartography of highly pathogenic H5N1 avian influenza virus made by using AntigenMap (http://sysbio.cvm.msstate.edu/AntigenMap) (2, 3). The cartography is based on the results from hemagglutination inhibition assays in horse red blood cells. One unit (grid) represents a 2-fold change in HI assay results. The cartography includes 16 influenza viruses (see Table S3 in the supplemental material), which includes four reference viruses, HK/156/97 (clade 0), Vietnam/1194/04 (clade 1), Indonesia/1/05 (clade 2.1), and Turkey/1/05 (clade 2.2) (26, 29).

