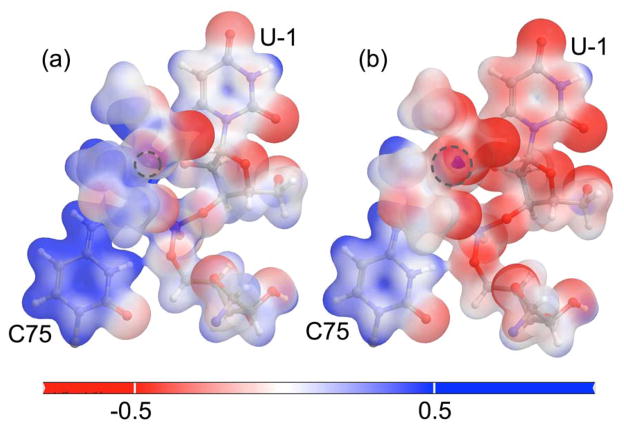
Figure 4.
Molecular electrostatic potential mapped onto the electron density isosurface. The QM region is shown here for the reactant state with (a) a Mg2+ ion and (b) a Na+ ion at the catalytic position. In both panels, the scale is from −0.5 to 0.5 kT/e at 298 K. The dotted gray circle indicates the position of the metal ion in each case. These figures suggest that the Mg2+ ion at the catalytic site withdraws greater electron density from C75, making the residue more electron deficient and the transferring proton more acidic, as compared to the case of a Na+ ion at the catalytic site.

