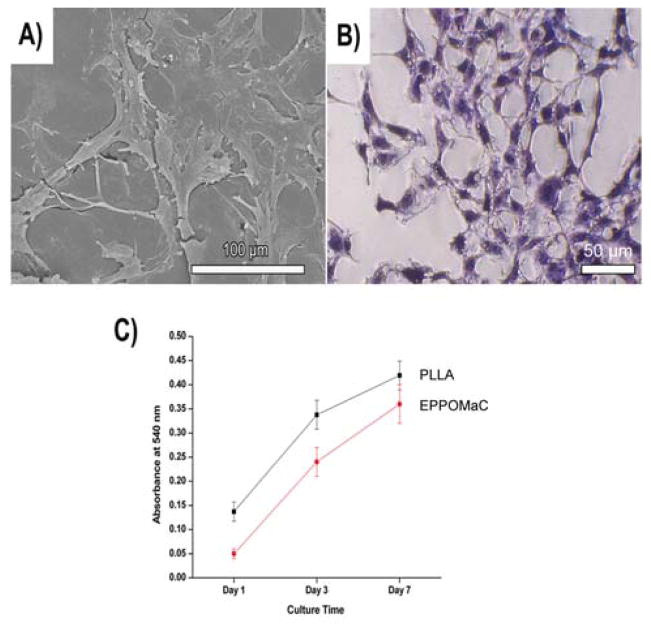
Fig. 7.
(A) Representative SEM image of NIH 3T3 fibroblast spreading after 72 h of culture on EPPOMaC. (B) Representative photomicrograph of the H&E stained cell monolayer after 72 h of culture on EPPOMaC. (C) Comparison of 3T3 fibroblast growth and proliferation on PLLA (relative control) and EPPOMaC scaffolds. MTT absorption was measured at 570 nm (n = 6).

