
Fig. 9.
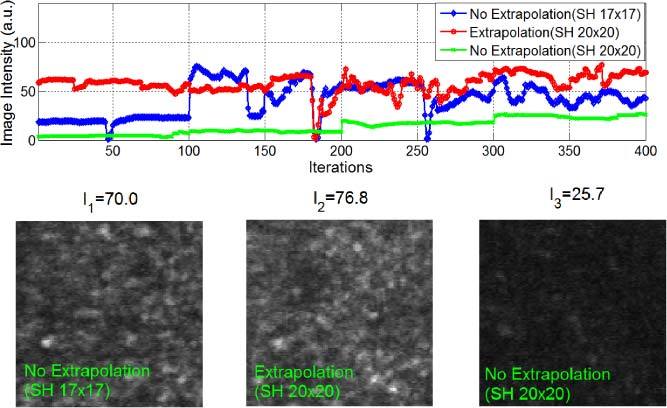
Experimental results with subject S2 (pupil size Φ6.5mm, SH 18 × 18). The blue curve represents image intensities obtained by AO imaging with the Φ6.12 mm sampling aperture (SH 17 × 17), while the red curve was the image intensity obtained with the boundary slope extrapolation algorithm (from the Φ6.5 mm pupil inscribed in the SH 18 × 18 grid to the Φ7.22 mm aperture inscribed in the SH 20 × 20 grid). The green curve shows the image intensity with the Φ7.22 mm sampling aperture (SH 20 × 20) without slope extrapolation. We can see that for a large SH grid (20 × 20) and a smaller eye pupil (Φ6.5mm), the AO control accuracy with slope extrapolation was higher than that without slope extrapolation, and it was more stable compared to the AO control using the optimal sampling aperture (SH 17 × 17). The large jumps in intensity arose from eye blinks.