
Fig. 3.
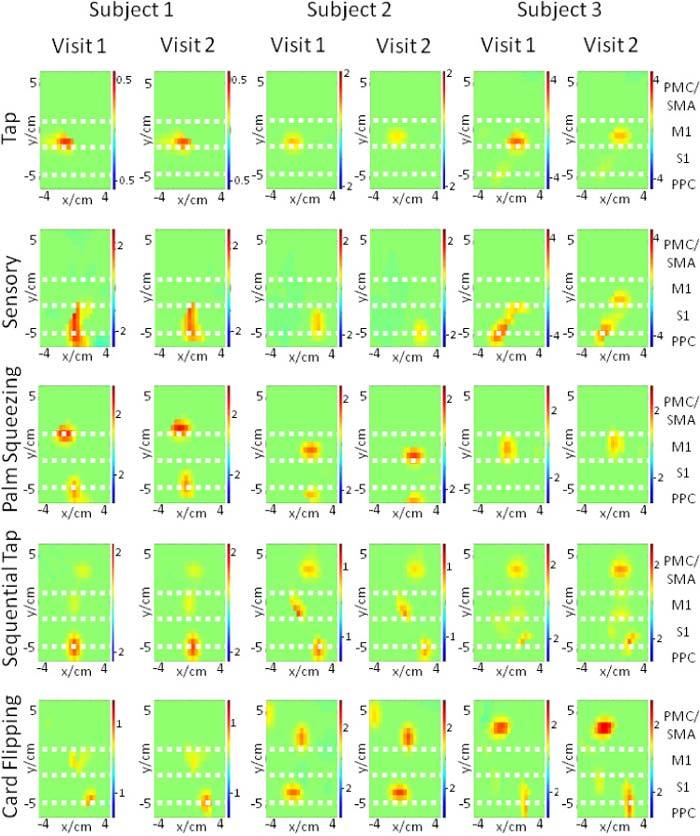
HbO activation images, having color scales in µMolar, were time-averaged between 5 – 20 s for each task on both visits for all three subjects. The white dashed lines were used to approximately separate the PMC/SMA, M1, S1, and PPC cortical regions, as identified on the far right edge of the figure.