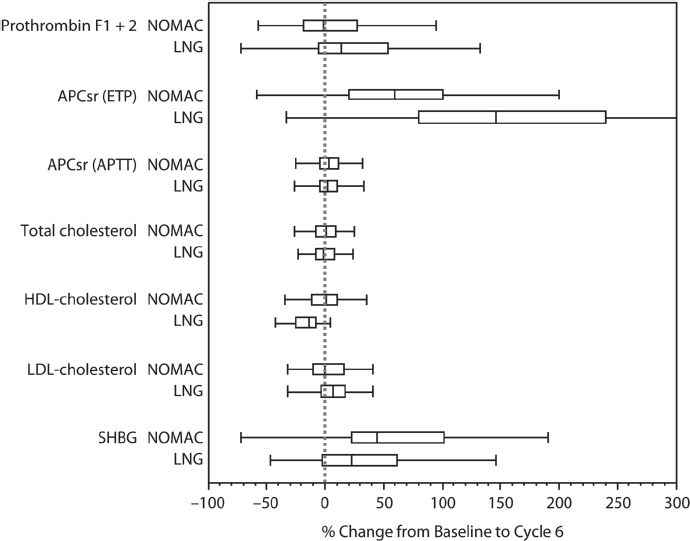
Figure 2.

Box whisker plots for NOMAC/E2 and LNG/EE of relative changes from baseline to end of cycle 6 in selected haemostatic and lipid parameters and SHBG. The edges of the boxes present the 25th and 75th sample percentiles (quartiles). The distance between these sample percentiles is the interquartile range. The vertical line in the box shows the median and the whiskers are drawn up to the smallest and largest value within 1.5-times the interquartile range. NOMAC, nomegestrol acetate/17β-oestradiol; LNG, levonorgestrel/ethinylestradiol; APCsr, activated protein C sensitivity ratio; ETP, endogenous thrombin potential; aPTT, activated partial thromboplastin time; HDL-C, high-density lipoprotein cholesterol; LDLC, low-density lipoprotein cholesterol; SHBG, sex hormone-binding globulin.
