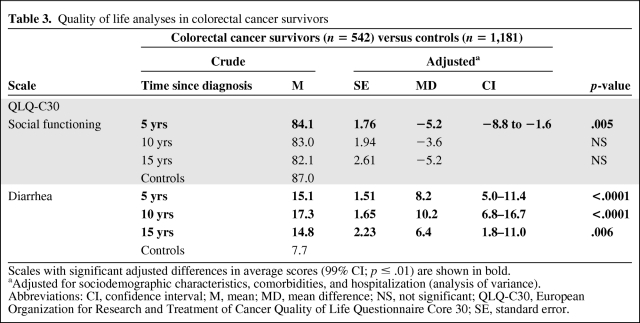
Table 3.
Quality of life analyses in colorectal cancer survivors
Scales with significant adjusted differences in average scores (99% CI; p ≤ .01) are shown in bold.
aAdjusted for sociodemographic characteristics, comorbidities, and hospitalization (analysis of variance).
Abbreviations: CI, confidence interval; M, mean; MD, mean difference; NS, not significant; QLQ-C30, European Organization for Research and Treatment of Cancer Quality of Life Questionnaire Core 30; SE, standard error.

