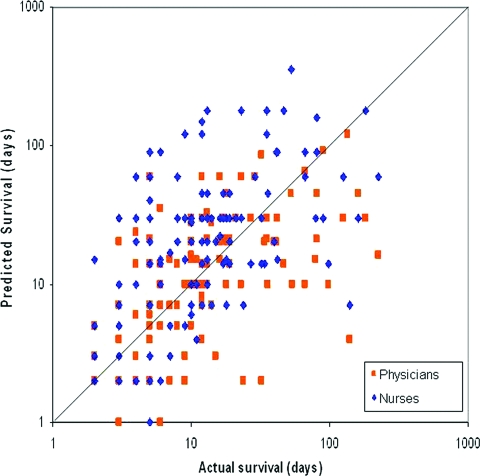
Figure 1.
Predicted survival versus actual survival by physicians and nurses for 127 patients who died. The diagonal line depicts perfect concordance, with dots above suggesting overestimation and dots below suggesting underestimation. This plot shows that nurses (♦) were more optimistic than physicians (■) in estimating survival. A logarithmic scale is used for both x-axis and y-axis.

